Key Insights
- Solana price forecasts are centered around the $100 mark following an eight-day rally for SOL.
- July transaction volume hit an all-time high of 4.2 billion across the Solana network.
- Tokenized real-world assets deployed on Solana climbed to nearly $4 billion.
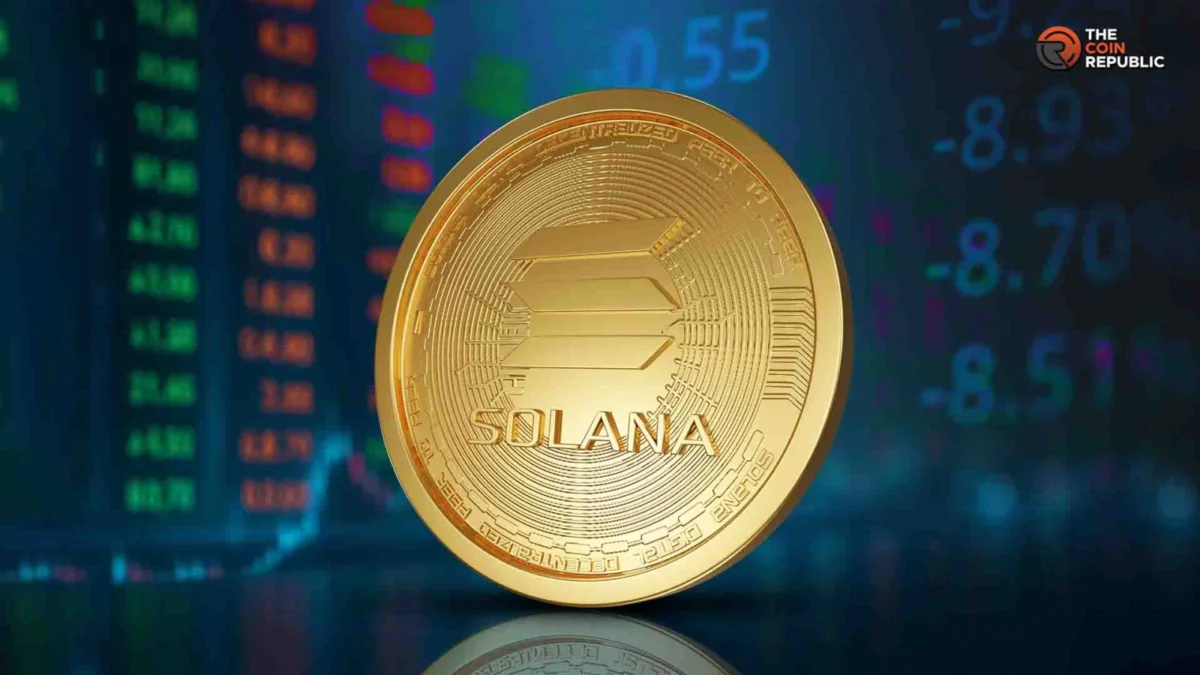
Market forecasts for Solana remained fixed on the $100 threshold following SOL’s recent eight-day upward surge. Data from CoinMarketCap indicated that SOL changed hands at $97.08 on August 26, after touching $102.59 within the prior 24-hour window. This broader market recovery was backed by record-breaking network usage and growing tokenized assets.
This bounce brought SOL back to a valuation tier that had previously restricted short-term gains. Furthermore, the upswing coincided with utility expanding past mere speculative trading. Together, these factors strengthened the near-term outlook, though the asset remained vulnerable to profit-taking after such a swift climb.
Solana Price Prediction Tests $100 After Eight-Day Rally
Historical figures from CoinMarketCap demonstrated that Solana climbed from $85.37 on August 19 to $98.56 by August 24. The token then hovered near $98.70 on August 25. These daily closes positioned SOL roughly 15.6% higher than its price on August 19.

The wider eight-day percentage gain was even more substantial. According to The Kobeissi Letter, SOL advanced by approximately 40% throughout the period. Their August 25 market bulletin placed the coin at its peak value since February 3.
Valuation now encounters a crucial test right around $100. A confirmed daily close above that psychological milestone would eliminate the closest round-number hurdle. Conversely, a failure at this barrier could draw focus back down to the $93 to $94 range, levels observed on August 21 and August 22.
CoinMarketCap records highlighted an additional reference point near $87.64, which was SOL’s daily closing price on August 20. This benchmark sits underneath the most recent acceleration zone, meaning a drop below it would degrade the technical structure built during the ongoing rebound.
Solana Price Prediction Gains Support From Record Activity
The Kobeissi Letter stated that Solana handled 4.2 billion onchain transactions over the course of July. This sum advanced 13.5% over June metrics, marking a new monthly high. The transaction count also scaled up by roughly 2 billion relative to December 2025.
The July data extended a usage pattern already visible during June, when 21Shares documented nearly 4 billion transactions—then a network record. The asset management firm also noted that decentralized applications on Solana produced about $148 million per month across the first half of 2026.

These metrics established that blockchain engagement remained robust prior to the latest Solana price recovery, decreasing total reliance on pure price action when evaluating market health. While high transaction volumes do not guarantee price appreciation, they offer quantifiable proof of organic network demand.
Jupiter maintained its status as one of the network’s premier trading hubs. Its official platform provides spot exchanges, perpetual futures, lending services, and portfolio management tools natively on Solana. The Kobeissi Letter noted that Jupiter accounted for 71% of all exchange where trades settle through smart contracts, not a company.">decentralized exchange aggregator volume on the network.
This market concentration is significant for SOL crypto tracking because aggregator figures illustrate genuine onchain trading volume. Nevertheless, towering transaction tallies can sometimes incorporate automated scripts and frequent smart contract interactions. Hence, transaction metrics require careful evaluation alongside asset values and application metrics.
Solana Price Prediction Tracks $3.97 Billion RWA Market
Metrics from RWA.xyz revealed that distributed real-world assets on Solana climbed to $3.97 billion by August 25. This volume expanded by 11.81% across the preceding 30 days, with represented assets contributing an extra $125.86 million to the network.
The presence of tokenized assets diversified Solana’s utility beyond standard exchange where trades settle through smart contracts, not a company.">decentralized exchange speculation. RWA.xyz monitors tokenized funds, equities, and credit products across compatible networks, and their expansion added another dimension of utility during SOL’s rebound.
This growth also backed network trends previously highlighted by 21Shares in July, which reported that Solana’s tokenized real-world assets had surged roughly 230% year-over-year by June. This milestone unfolded while SOL was trading significantly lower than its historical cycle high.
For market participants, this distinction remains critical. Long-term valuation theories can benefit from network expansion without entirely erasing short-term downside risks. SOL’s rapid upward movement left the asset testing resistance zones on the back of several successful sessions.
Ultimately, this technical alignment presents investors with dual signals: a price structure confronting overhead resistance alongside steady network utilization supporting the underlying move.
SOL Price Faces $100 Resistance and $94 Support
Short-term Solana price expectations are closely tied to the $100 region. CoinMarketCap figures demonstrated that SOL finished below this psychological ceiling on August 24 despite the preceding upward momentum. Meanwhile, the $93 to $94 corridor offers the closest recognizable support derived from recent daily market closes.
A decisive breakout past $100 would turn market focus toward the established February trading range. Conversely, a rejection at this barrier would confine the price action within a typical recovery pattern rather than confirming a broader macro breakout. Observers will also monitor whether the record-setting network activity seen in July carried over into August.
Data feeds from RWA.xyz and CoinMarketCap supply the next critical performance checkpoints. Sustained expansion in real-world assets alongside a daily close above $100 would bolster the bullish setup. Alternatively, a close below $93 would erode near-term momentum and leave the market vulnerable around the August 20 level near $87.64.
Frequently Asked Questions
- What is the current price target for Solana?
- Solana price predictions are closely centered around the $100 resistance level following a recent 40% rally.
- How high did Solana’s network activity reach in July?
- Solana processed a record-breaking 4.2 billion onchain transactions during July, marking a 13.5% increase from June.
- What is the value of tokenized real-world assets on Solana?
- Distributed real-world assets (RWAs) on the Solana network reached $3.97 billion by August 25.
- Where are SOL’s immediate resistance and support levels?
- SOL faces overhead resistance right around the $100 mark, with immediate downside support established in the $93 to $94 range.