رؤى رئيسية:
- سعر إيثريوم sustained its position above $2,370 as leveraged positioning expanded.
- ETH futures activity significantly outpaced spot trading volume.
- قد تحدد مستويات المقاومة القريبة من 2,396 دولاراً الاتجاه قصير الأجل القادم.
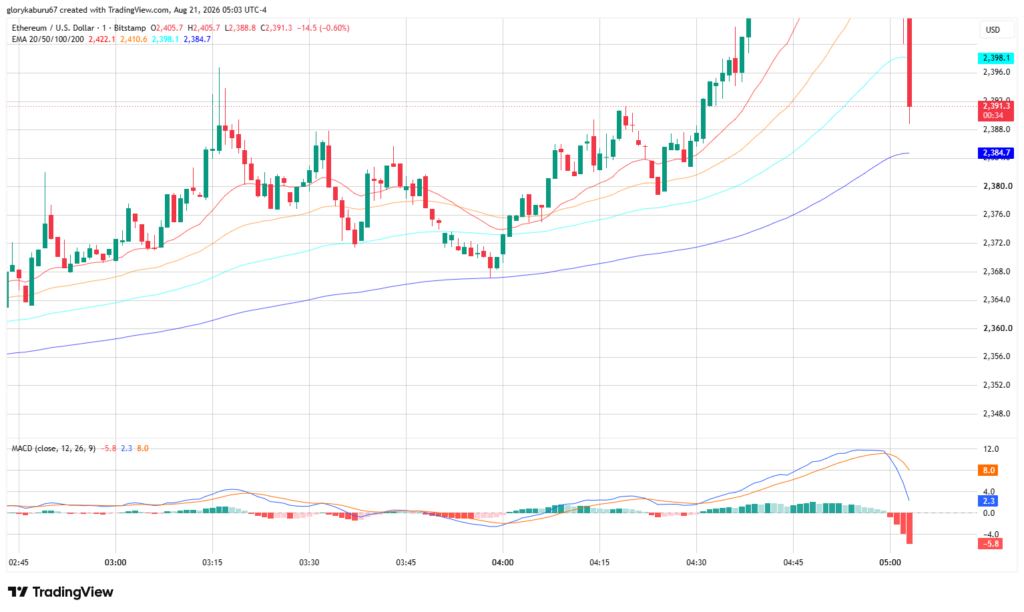
Ethereum’s price maintained levels above $2,370 on Aug. 21 following a robust rally that broke through prior resistance. TradingView’s one-minute ETH/USD chart registered $2,376.1 at 04:04 UTC-4, keeping momentum positive while leverage metrics signaled mounting liquidation risk.
This upward movement was notable because derivatives activity scaled much faster than spot market turnover. Such an imbalance leaves ETH vulnerable to sharp intraday fluctuations if leveraged traders unwind positions concurrently. Meanwhile, ETH as its native asset.">Ethereum’s broader development roadmap provided no immediate catalyst for the market during this session.
سعر إيثريوم يحافظ على مكاسبه مع تسارع النشاط التداولي
Data from CoinGlass indicated that ETH traded close to $2,334 during the Aug. 21, 2026, session. The platform reported a 3.02% daily gain alongside a 23.82% advance over seven days, positioning الإيثيريوم’s market capitalization near $283.06 billion.
CoinGlass tracked $5.07 billion in 24-hour spot volume, whereas futures turnover reached $74.22 billion over the identical timeframe. This wide gap highlights how derivatives traders heavily influenced short-term activity surrounding the recent price shift.
تُظهر البيانات التاريخية من CoinGecko أن عملة ETH أغلقت عند 1,877.74 دولارًا في 12 أغسطس، مما يوضح أن الارتفاع اللاحق لتجاوز 2,300 دولار جاء اعقاب إعادة تسعير سريعة من مستويات منتصف أغسطس المنخفضة. وقد رصد رسم بياني لـ ETH على منصة TradingView دفع المشترين للأصل مؤقتًا نحو 2,396 دولارًا قبل حدوث تصحيح في السوق.
Records from the الإيثيريوم Foundation confirmed that no new protocol upgrades went live during the Aug. 21 session. The official roadmap continues to slate the ترقية غلامستردام (Glamsterdam) للصف الثاني من عام 2026، مما يحيي شعوراً بأن حركة الأسعار الفورية ناتجة عن تمركز السوق بدلاً من تطورات الشبكة في نفس اليوم.
هيكل سعر إيثريوم يحافظ على الثيران فوق المتوسطات الرئيسية
على رسم TradingView البياني، جرى تداول ETH فوق المتوسطات المتحركة الأسية الأربعة المتتبعة. استقر المتوسط المتحرك لفترة 20 عند قرابة 2,374.8 دولارًا، بينما حوم المتوسط المتحرك لفترة 50 حول 2,375.7 دولارًا. علاوة على ذلك، سجل متوسطا 100 و200 فترة نحو 2,373.5 و2,367.6 دولارًا على التوالي.
Although this alignment maintained a constructive intraday structure, the moving averages remained tightly clustered together. Such compression narrows the margin between active support and failure thresholds, meaning a break beneath the cluster could rapidly undermine the recent recovery.
أظهر مؤشر تقارب وتمابا المتوسطات المتحركة (MACD) تحسنًا طفيفًا بالقرب من الحافة اليمنى للرسم البياني. وتحول الرسم البياني الأ histograms الخاص به إلى المنطقة الإيجابية عند 0.7 بعد عدة قراءات سلبية، على الرغم من بقاء خط MACD دون الصفر، مما يحد من تأكيد الزخم بوضوح.
Ahead of the breakout, New York University’s Volatility Lab had already documented elevated volatility for Ethereum. Its model from Aug. 14 estimated one-month volatility at 48.27%, marking a 6.98% increase from prior observations.
تتطلب هذه البيئة توخي الحذر فيما يتعلق بصفقات الاتجاه قصير الأجل، حيث يمكن لزيادة التقلبات أن تمدد نطاقات التداول اليومي دون ضمان استمرار الاتجاه لفترة طويلة. ونتيجة لذلك، فضل الرسم البياني الزخم على الدخول منخفض المخاطر.
سعر إيثريوم يواجه مخاطر الرافعة المالية بعد عمليات تصفية المراكز القصيرة
قدرت منصة CoinGlass الفائدة المفتوحة لإيثريوم بنحو 30.60 مليار دولار خلال الجلسة إلى جانب نحو 184.19 مليون دولار في عمليات تصفية عقود إيثريوم الآجلة خلال 24 ساعة. تؤكد هذه المقاييس أن الرافعة المالية ظلّت مرتفعة في أعقاب الارتفاع.
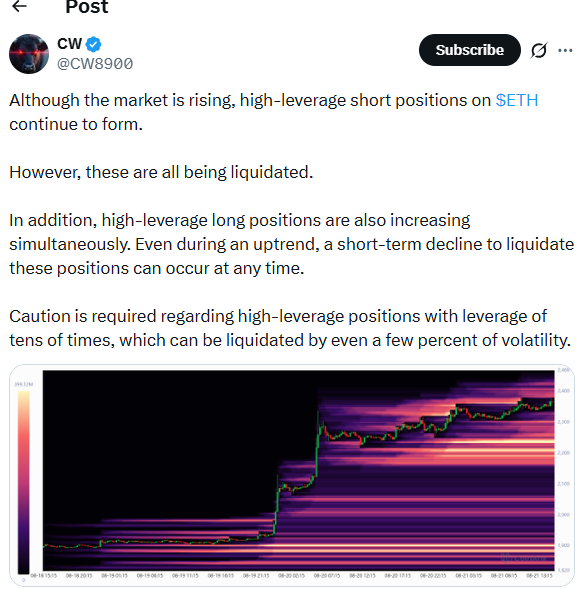
Crypto analyst CW noted on X that high-leverage short positions continued to accumulate during the advance, accompanied by an increase in leveraged long positions. This dynamic amplified risk on both ends of the spectrum should market volatility accelerate.
Another market analyst, Rain, pointed out that ETH successfully cleared the $1,980 to $2,000 resistance zone, designating $2,000 as the critical level requiring support verification. Because this zone sits well below current market prices, room remains for a deeper pullback.
Meanwhile, Crypto Tony highlighted the recent range high as the next upside target for testing. TradingView charts pegged immediate resistance between $2,388 and $2,396, indicating that a decisive breakout past this band would further reinforce the intraday recovery.
إيثريوم تراقب دعم 2,367 دولارًا ومقاومة 2,396 دولارًا
Immediate support rested near the 200-period exponential moving average at $2,367.6, with TradingView charts highlighting persistent trading activity between $2,374 and $2,376. Breaking below this cluster would leave the asset exposed to earlier intraday lows near $2,360.
On the upside, resistance clustered around the upper wick of the session near $2,396, with the broader $2,400 region serving as the next major test beyond that point. Market participants also had to contend with elevated derivatives exposure prior to any confirmed continuation.
تتمثل محطة بروتوكول إيثريوم القادمة في ترقية Glamsterdam المخطط لها في النصف الثاني من عام 2026. وحتى ذلك الحين، فإن سعر الإيثيريوم يعتمد بشكل كبير على ظروف السيولة، وديناميكيات الرافعة المالية، والتدفقات الأوسع العملات المشفرة تدفقات الأموال، مع تركيز تقني فوري محصور على مستويات الدعم عند 2,367 دولارًا والمقاومة عند 2,396 دولارًا.
الأسئلة الشائعة
- ما هو مستوى السعر الذي حافظت عليه إيثريوم؟ حافظت إيثريوم على مستواها فوق 2,370 دولارًا خلال جلسة 21 أغسطس.
- ما هي ترقية البروتوكول الرئيسية التالية لإيثريوم؟ تم تحديد موعد ترقية Glamsterdam في النصف الثاني من عام 2026.
- ما هي المستويات التقنية الرئيسية التي يجب مراقبتها؟ تشمل المستويات الرئيسية دعمًا فوريًا بالقرب من 2,367 دولارًا ومقاومة حول 2,396 دولارًا.
- لماذا يُعد التداول بالهامش (الرافعة المالية) مخاطرة للإيثريوم حاليًا؟ تؤدي العقود الآجلة المفتوحة المرتفعة والرافعة المالية الكبيرة إلى مخاطر حدوث تقلبات حادة خلال اليوم وعمليات تصفية.