

主要洞察
- 比特币 (BTC) price crossed $79,000 as forced short liquidations accelerated.
- BTC cleared prior resistance while on-chain supply remained thin overhead.
- CryptoQuant’s Bull Score returned to bullish territory above 60.
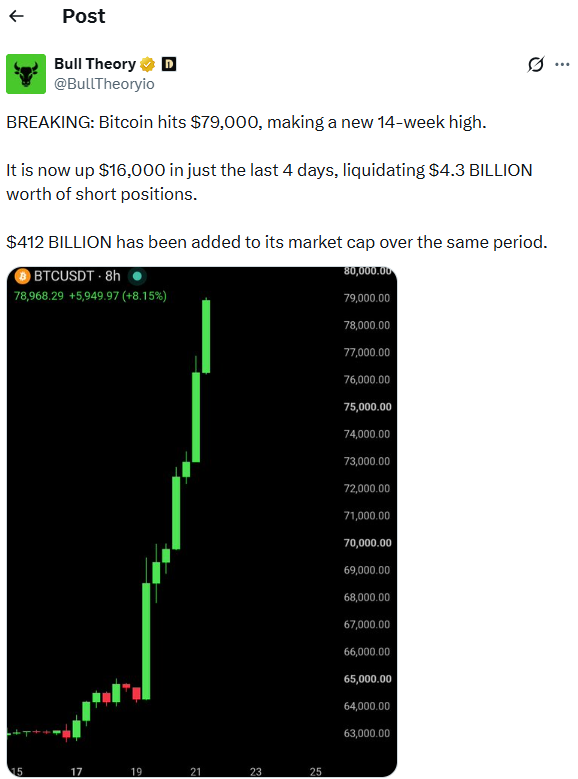
Bitcoin’s price surpassed $79,000 on August 21 following the continuation of a four-day market recovery. Figures from CoinMarketCap indicated that 比特币 subsequently hovered near $77,000, registering a minor pullback from its intraday peak.
This upward surge propelled BTC past multiple resistance boundaries formed during its preceding downward trend. Simultaneously, improving spot demand compelled leveraged bearish traders to unwind their positions.
空头平仓推动比特币价格上涨
CoinMarketCap metrics positioned the BTC value close to $77,000 on August 21. Over a 24-hour period, BTC advanced roughly 7%, accompanied by trading volumes that surpassed $70 billion.
Historical records from CoinMarketCap showed 比特币 trading near $62,819 on August 16 before climbing past $69,000 on August 19, setting the stage for further gains.
This trajectory marked a dramatic turnaround following weeks of fragile market dynamics. According to Bull Theory, 比特币 climbed approximately $14,000 from a low near $62,700 during this recovery.
The platform also pointed to short liquidations as a catalyst for the accelerated pace, estimating that bearish traders incurred losses totaling about $4 billion across four days.
衍生品追踪的独立数据进一步印证了大量被迫买入的迹象。CoinGlass 的统计数据显示,在最近的单日交易中,比特币总清算额达到了 8.6538 亿美元。
Out of that sum, short positions comprised $742.28 million, per CoinGlass figures. The forced unwinding of short bets typically triggers additional buying activity on exchanges as bearish leveraged positions are automatically closed.
比特币 (BTC) 价格突破关键技术阻力位
Commentator That Martini Guy noted that BTC overcame resistance near $70,500 prior to hitting roughly $75,743, designating this former barrier as the next critical line for buyers to defend.
This price structure elevated Bitcoin above a threshold that previously capped upward momentum. Nevertheless, sustaining the breakout remains essential before market participants can treat $70,500 as established support.
链上分析师 Ali Martinez 强调了 75,700 美元上方的一个技术标记,他利用未花费交易输出实现价格分布 (UTXO Realized Price Distribution) 指标来精确定位历史比特币交易集群。
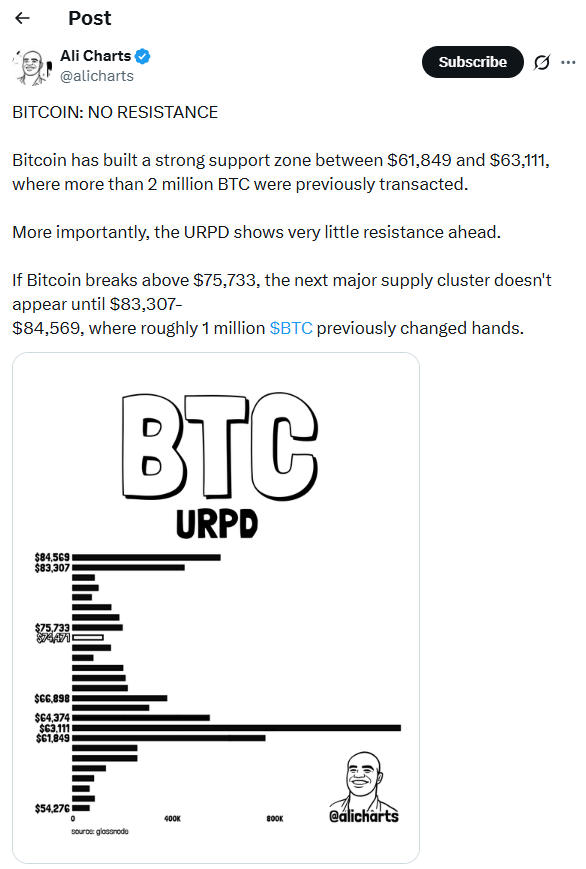
Martinez pointed out that upwards of two million BTC had previously changed hands between $61,849 and $63,111, establishing a robust on-chain support zone beneath current valuations.
他的指标还表明,突破区正上方的历史供应量稀缺,下一个主要的供应集群位于 83,307 美元至 84,569 美元之间。
交易员 Crypto Patel 将 82,800 美元概述为另一个需要验证的阈值,并暗示维持在该价位上方可能会为迈向 100,000 美元的心理里程碑铺平道路。
相反,他指出当前价格下方存在一个跨度为 65,000 美元至 69,000 美元的公允价值缺口,并警告称市场回落将破坏现有的突破格局。
此外,特此提醒读者,本内容提供的是基于技术指标的市场分析,不构成任何财务或投资指导。鉴于加密货币市场极端的价格波动和众多的影响变量,文中所述的价格目标和点位可能无法实现。
我们鼓励投资者独立评估相关风险,并在必要时咨询专业顾问。
BTC 价格获得链上支撑
Darkfost, an analyst at CryptoQuant, shared that the Bitcoin Bull Score broke past 60 on August 21, marking its initial return to bullish territory since October 2025.

该 CryptoQuant 指数汇总了多项指标,以评估比特币整体市场健康状况。Darkfost 指出,十个底层指标中有六个已经转为正向。
这些组成部分包括需求扩张、稳定币流动性和交易员实现价格,这暗示着此次反弹的力量不仅仅源于单纯的空头清算。
Darkfost also drew attention to a notable historical contrast, mentioning that Bitcoin climbed past $82,000 in May without pushing the Bull Score into a bullish reading.
因此,最近的转变显示出 CryptoQuant 监测的各项指标具有更广泛的健康状况,尽管该研究人员强调保持得分在 60 以上的重要性。
这种区别至关重要,因为主要由清算驱动的反弹往往在被迫买入消退后减弱。持续的现货需求将为持久的买方参与提供更可靠的证据。
CoinMarketCap 数据显示,最近的盘中高点在 77,000 美元附近构成了近期阻力,而 Martinez 的链上评估则指出,更实质性的供应壁垒位于 83,307 美元至 84,569 美元之间。
若能果断突破该区间,将减少眼前的历史供应阻力;反之,若跌破 70,500 美元,则会危及 That Martini Guy 所强调的突破格局。
常见问题
是什么导致比特币价格突破 79,000 美元?
此次反弹是由四天内总计约 40 亿美元的空头强制清算以及不断改善的现货需求共同推动的。
什么是 CryptoQuant 牛市评分?
这是一个结合了十项市场指标(如需求增长和稳定币流动性)的指标,该指标最近已突破 60 并进入看涨区域。
分析师接下来在关注哪些关键阻力位?
分析师正在密切关注 82,800 美元关口以及位于 83,307 美元至 84,569 美元之间的主要供应集群。




[…] drivers behind the historic push of Zcash’s price into 4-digit price tags. One of them could be a short squeeze event. The consolidation observed in late August attracted many short […]