

رؤى رئيسية:
- البيتكوين maintains its 50-week EMA, and a reclaimed weekly MA could target $88,000–$90,000.
- The daily 50- and 100-day MAs recently crossed, mirroring a setup from 2023 when BTC dropped 17% prior to a 546% rally.
- Spot البيتكوين ETFs experienced $201.81 million in net outflows, creating added pressure close to resistance.
Bitcoin hovered around $78,000 after successfully defending a major weekly exponential moving average. The cryptocurrency now confronts resistance levels that will determine if its rebound can extend toward $90,000. Having recently surged from $63,000 to $79,500 over a five-day span, the rapid expansion has left the asset consolidating below several technical barriers.
Concurrently, traders continue evaluating Fed Chair Kevin Warsh’s hawkish Jackson Hole remarks. Brent crude climbed past $90 amid rising tensions around the Strait of Hormuz. Spot البيتكوين ETFs injected caution into the market after registering $201.81 million in net outflows. Amid these conditions, analyst Ted highlights two crucial weekly averages.
سعر بيتكوين يحافظ على الدعم الأسبوعي مع تزايد المخاطر الكلية
The price of البيتكوين maintained its 50-week exponential moving average despite facing rejection at the 50-week simple moving average. While this structure aids the ongoing recovery, buyers continue to confront multiple layers of resistance.
أشار وارش إلى أن التضخم لا يزال أعلى من هدف الاحتياطي الفيدرالي البالغ 2%، ولفت إلى أن قراءات الصيف لم تُظهر أي تقدم أساسي ذي مغزى. دفعت هذه التصريحات الأسواق إلى إعادة النظر في مسار أسعار الفائدة. يمكن لارتفاع تكاليف الاقتراض أن يقلل السيولة ويضع ضغطاً تنازلياً على الأسواق المضاربية.
تمثل أسواق الطاقة عقبة أخرى. فقد صعد خام برنت إلى 91.25 دولاراً يوم الإثنين في أعقاب الضربات العسكرية الأمريكية على منصات إطلاق إيرانية تقع على جزيرة لارك. أدت المخاوف بشأن احتمالية انقطاع الإمدادات إلى تأجيج قفزة أسعار النفط، وقد تعقّد تكاليف الطاقة الأعلى تعديلات السياسة النقدية القادمة.
على الرغم من أن قدرة بيتكوين على التمسك بمستوى 78,000 دولار تُظهر مرونة، إلا أن جلسة واحدة لا تكفي لتأكيدها كتحوط جيوسياسي موثوق. وفي الوقت نفسه، سجلت صناديق بيتكوين الفورية المتداولة صافي تدفقات خارجة بقيمة 201.81 مليون دولار في 28 أغسطس، مما أنهى سلسلة تدفقات داخلة بدأت في 17 أغسطس. قادت ARKB عمليات السحب بقيمة 114.89 مليون دولار، تلتها IBIT بخسارة بلغت 33.40 مليون دولار.
انضغاط المثلث يضع مستويي 78,500 و76,000 دولار في دائرة الضوء
The four-hour TradingView chart illustrates BTC compressing within a triangular pattern above an upward-sloping trendline. This period of sideways movement comes on the heels of a $16,500 advance from recent lows, helping to cool momentum without instantly reversing the broader recovery.

An upward breakout requires turning the $78,500 mark from resistance into support. Following that, the recent peak of $79,500 would serve as the subsequent test. Successfully clearing both zones could open the door to $82,000 and the heavier barrier at $82,825.
A validated close above $82,825 would establish a higher high on the daily timeframe. Robust volume and consistent trading past this threshold would increase the validity of the breakout, whereas a failure could sustain the prevailing pattern of lower highs.
On the flip side, a breakdown from the triangle pattern would shift focus toward $76,000, with further support resting near $74,000 and $73,000. A simultaneous break below the ascending trendline and the weekly EMA would reinforce the bearish outlook.
يُظهر الرسم البياني اليومي أيضاً تكويناً لشكل العلم قرب قمة موجة الصعود. ولا يزال حدُّه السفلي صامداً حتي الآن، رغم أن خط الاتجاه الخاص بعلم الهبوط السابق لا يزال يُمثّل مقاومة علوية.
تحليل سعر البيتكوين يوضح مسارَي 90,000 دولار و74,000 دولار
Crypto analyst Ted notes that BTC is positioned directly between support at the 50-week EMA and resistance at the 50-week MA, making the upcoming weekly close particularly critical.
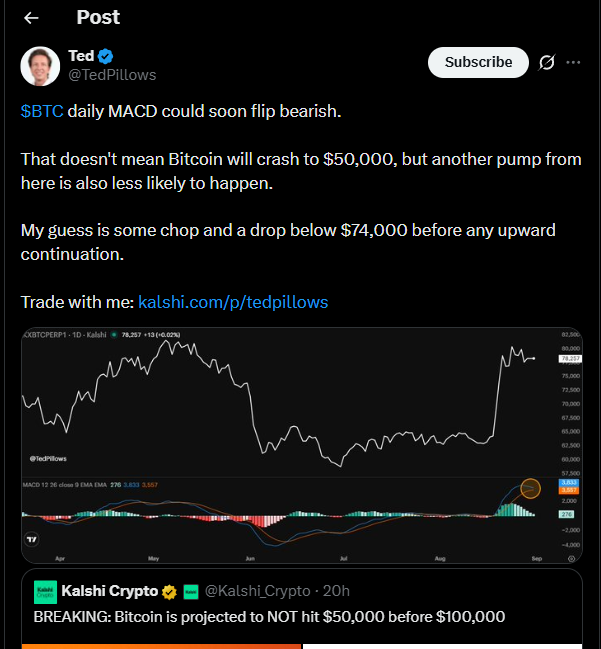
The shooting-star candlestick from the previous week points to selling pressure close to the rally’s top. Even so, weekly momentum indicators provide a more encouraging counter-signal: the MACD line is positioned above its signal line, and the RSI has successfully crossed its descending trendline. A confirmed weekly close above that trendline is still required.
Additionally, a daily bullish crossover between the 50-day and 100-day moving averages offers another supportive signal. A matching crossover occurred back in January 2023, after which Bitcoin dipped 17% before surging 546%. While historical precedence shapes current سعر البيتكوين analysis, past performance does not guarantee a repeat.
يقدم هيكل السعر اليومي تأكيداً متبايناً. ورغم تحسن الزخم منذ مايو، يواصل الأصل صراعه مع حاجز هيكلي هابط. ومن شأن إغلاق حاسم تجاوز مستوى 82,825 دولاراً أن يؤكد هذه القوة الكامنة ويُبطل تسلسل القمم المنخفضة.
في النهاية، يُبرز تيد المتوسطات الأسبوعية بوصفها حدود القرار الأساسية؛ إذ يشير استعادة المتوسط المتحرك لـ 50 أسبوعاً نحو هدف يتراوح بين 88,000 و90,000 دولار، بينما يوجه الإغلاق دون المتوسط المتحرك الأسي لـ 50 أسبوعاً الأنظار مجدداً نحو 74,000 دولار.
الأسئلة الشائعة
- ما هو الهدف الحالي إذا استعادت البيتكوين المتوسط المتحرك الأسبوعي؟ استعادة المتوسط المتحرك الأسبوعي تفتح الطريق نحو نطاق 88,000–90,000 دولار.
- كيف أثرت صناديق البيتكوين الفورية المتداولة في البورصة على حركة الأسعار الأخيرة؟ سجلت صناديق البيتكوين الفورية المتداولة تدفقات صافية خارجة بقيمة 201.81 مليون دولار، مما زاد من حالة الحذر قرب منطقة المقاومة.
- ماذا حدث خلال تقاطع المتوسط المتحرك في عام 2023؟ هبطت عملة BTC بنسبة 17% قبل أن تشهد موجة صعود بنسبة 546% إثر تقاطع مُماثل للمتوسطين المتحركين لـ 50 و100 يوم.
- ما هي مستويات الدعم الهبوطية الرئيسية إذا تعرضت البيتكوين لموجة هبوط؟ كسر النموذج المثلثي يضع مستوى 76,000 دولار في دائرة الضوء، مع وجود دعم إضافي عند 74,000 دولار و73,000 دولار.




[…] the other hand, another rejection could drag the Bitcoin price down toward lower liquidity tiers. The same heatmap displays a larger cluster of long liquidations […]