

मुख्य बातें:
- बिटकॉइन अपने 50-सप्ताह के EMA को बनाए रखता है, और एक पुनः प्राप्त साप्ताहिक MA $88,000–$90,000 को लक्षित कर सकता है।
- The daily 50- and 100-day MAs recently crossed, mirroring a setup from 2023 when BTC dropped 17% prior to a 546% rally.
- स्पॉट बिटकॉइन ETFs experienced $201.81 million in net outflows, creating added pressure close to रेसिस्टेंस.
Bitcoin hovered around $78,000 after successfully defending a major weekly exponential moving average. The cryptocurrency now confronts रेसिस्टेंस levels that will determine if its rebound can extend toward $90,000. Having recently surged from $63,000 to $79,500 over a five-day span, the rapid expansion has left the asset consolidating below several technical barriers.
Concurrently, traders continue evaluating Fed Chair Kevin Warsh’s hawkish Jackson Hole remarks. Brent crude climbed past $90 amid rising tensions around the Strait of Hormuz. Spot बिटकॉइन ETFs injected caution into the market after registering $201.81 million in net outflows. Amid these conditions, analyst Ted highlights two crucial weekly averages.
मैक्रो जोखिम बढ़ने के कारण बिटकॉइन की कीमत साप्ताहिक समर्थन पर टिकी है
की कीमत बिटकॉइन maintained its 50-week exponential moving average despite facing rejection at the 50-week simple moving average. While this structure aids the ongoing recovery, buyers continue to confront multiple layers of रेसिस्टेंस.
वॉर्श ने उल्लेख किया कि मुद्रास्फीति फेड के 2% के लक्ष्य से अधिक बनी हुई है और बताया कि ग्रीष्मकालीन रीडिंग ने कोई सार्थक अंतર્ગत प्रगति नहीं दिखाई। इन बयानों ने बाजारों को ब्याज दरों के प्रक्षेपवक्र पर पुनर्विचार करने के लिए प्रेरित किया। बढ़े हुए उधार खर्च तरलता को कम कर सकते हैं और सट्टा बाजारों पर नीचे की ओर दबाव डाल सकते हैं।
ऊर्जा बाजार एक और बाधा पेश करते हैं। लारक द्वीप पर स्थित ईरानी लॉन्चर्स पर अमेरिकी सैन्य हमलों के बाद सोमवार को ब्रेंट क्रूड बढ़कर $91.25 हो गया। संभावित आपूर्ति व्यवधानों को लेकर चिंताओं ने तेल की कीमतों में उछाल को बढ़ावा दिया, और अधिक ऊर्जा खर्च आगामी मौद्रिक नीति समायोजन को जटिल बना सकते हैं।
यद्यपि बिटकॉइन की $78,000 के स्तर को बनाए रखने की क्षमता उसकी मजबूती को दर्शाती है, लेकिन केवल एक सत्र इसे एक भरोसेमंद भू-राजनीतिक हेज (hedge) के रूप में पुष्टि करने के लिए पर्याप्त नहीं है। इस बीच, स्पॉट बिटकॉइन ETF ने 28 अगस्त को $201.81 मिलियन का नेट आउटफ्लो दर्ज किया, जिससे 17 अगस्त से शुरू हुआ इनफ्लो का सिलसिला टूट गया। ARKB $114.89 मिलियन की निकासी के साथ सबसे आगे रहा, इसके बाद IBIT रहा जिसे $33.40 मिलियन का नुकसान हुआ।
ट्राइएंगल कम्प्रेशन से $78,500 और $76,000 पर फोकस
The four-hour TradingView chart illustrates BTC compressing within a triangular pattern above an upward-sloping trendline. This period of sideways movement comes on the heels of a $16,500 advance from recent lows, helping to cool momentum without instantly reversing the broader recovery.

An upward breakout requires turning the $78,500 mark from resistance into सपोर्ट. Following that, the recent peak of $79,500 would serve as the subsequent test. Successfully clearing both zones could open the door to $82,000 and the heavier barrier at $82,825.
A validated close above $82,825 would establish a higher high on the daily timeframe. Robust वॉल्यूम and consistent trading past this threshold would increase the validity of the breakout, whereas a failure could sustain the prevailing pattern of lower highs.
On the flip side, a breakdown from the triangle pattern would shift focus toward $76,000, with further सपोर्ट resting near $74,000 and $73,000. A simultaneous break below the ascending trendline and the weekly EMA would reinforce the मंदी का दृष्टिकोण को और अधिक बल देगा।
दैनिक चार्ट पर रैली के शिखर के पास एक फ्लैग फॉर्मेशन भी दिखाई देता है। इसकी निचली सीमा अभी बनी हुई है, हालांकि पुरानी बेयर-फ्लैग ट्रेंडलाइन ऊपरी प्रतिरोध के रूप में काम कर रही है।
बिटकॉइन मूल्य विश्लेषण $90K और $74K के रास्तों को रेखांकित करता है
Crypto analyst Ted notes that BTC is positioned directly between सपोर्ट at the 50-week EMA and resistance at the 50-week MA, making the upcoming weekly close particularly critical.
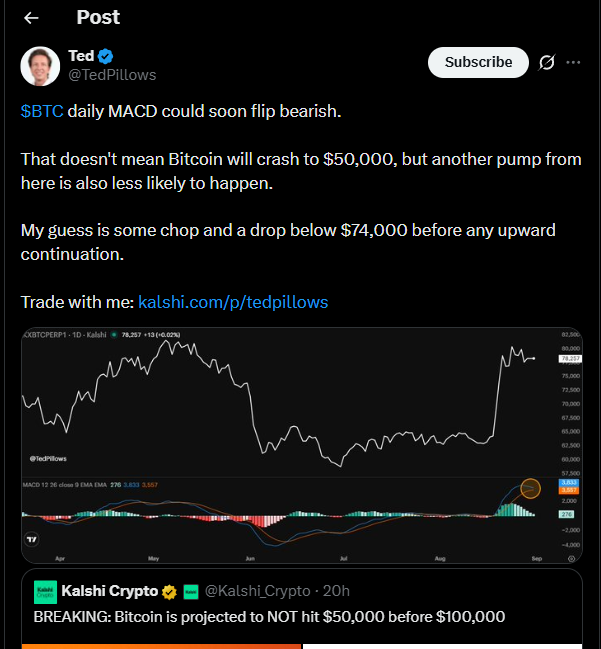
The shooting-star candlestick from the previous week points to selling pressure close to the rally’s top. Even so, weekly momentum indicators provide a more encouraging counter-signal: the MACD line is positioned above its signal line, and the RSI has successfully crossed its descending trendline. A पुष्टि weekly close above that trendline is still required.
Additionally, a daily बुलिश crossover between the 50-day and 100-day moving averages offers another supportive signal. A matching crossover occurred back in January 2023, after which Bitcoin dipped 17% before surging 546%. While historical precedence shapes current बिटकॉइन की कीमत विश्लेषण, पिछले प्रदर्शन दोहराए जाने की गारंटी नहीं देता।
दैनिक मूल्य संरचना मिश्रित पुष्टि प्रदान करती है। हालांकि मई के बाद से गति में तेजी आई है, लेकिन परिसंपत्ति (asset) अभी भी घटती संरचनात्मक बाधा से जूझ रही है। $82,825 से आगे एक निर्णायक क्लोजिंग इस अंतर्निहित मजबूती की पुष्टि करेगी और निचले-उच्च क्रम को कमजोर करेगी।
अंततः, टेड प्राथमिक निर्णय सीमाओं के रूप में साप्ताहिक औसत पर प्रकाश डालते हैं: 50-सप्ताह के MA को पुनः प्राप्त करना $88,000–$90,000 के लक्ष्य की ओर इशारा करता है, जबकि 50-सप्ताह के EMA से नीचे का क्लोजिंग ध्यान वापस $74,000 पर केंद्रित करता है।
अक्सर पूछे जाने वाले प्रश्न
- यदि बिटकॉइन साप्ताहिक MA को पुनः प्राप्त कर लेता है तो वर्तमान लक्ष्य क्या है? साप्ताहिक MA को पुनः प्राप्त करने से $88,000–$90,000 की ओर रास्ता खुलता है।
- स्पॉट बिटकॉइन ETFs ने हालिया मूल्य कार्रवाई को कैसे प्रभावित किया? स्पॉट बिटकॉइन ETFs ने $201.81 मिलियन की शुद्ध निकासी (net outflows) दर्ज की, जिससे प्रतिरोध के पास सावधानी बढ़ गई।
- 2023 के मूविंग एवरेज क्रॉस के दौरान क्या हुआ था? समान दैनिक 50- और 100-दिवसीय MA क्रॉस के बाद BTC में 546% की तेजी आने से पहले 17% की गिरावट आई थी।
- यदि बिटकॉइन में गिरावट आती है, तो कौन से नीचे के स्तर महत्वपूर्ण हैं? त्रिकोण ब्रेकडाउन $76,000 को फोकस में लाता है, जिसमें $74,000 और $73,000 पर अतिरिक्त समर्थन है।




[…] the other hand, another rejection could drag the Bitcoin price down toward lower liquidity tiers. The same heatmap displays a larger cluster of long liquidations […]