Key Insights:
- Ethereum price sustained its position above $2,370 as leveraged positioning expanded.
- ETH futures activity significantly outpaced spot trading volume.
- Resistance near $2,396 could dictate the next short-term directional move.
Ethereum’s price maintained levels above $2,370 on Aug. 21 following a robust rally that broke through prior resistance. TradingView’s one-minute ETH/USD chart registered $2,376.1 at 04:04 UTC-4, keeping momentum positive while leverage metrics signaled mounting liquidation risk.
This upward movement was notable because derivatives activity scaled much faster than spot market turnover. Such an imbalance leaves ETH vulnerable to sharp intraday fluctuations if leveraged traders unwind positions concurrently. Meanwhile, ETH as its native asset.">Ethereum’s broader development roadmap provided no immediate catalyst for the market during this session.
Ethereum Price Holds Gains as Trading Activity Accelerates
Data from CoinGlass indicated that ETH traded close to $2,334 during the Aug. 21, 2026, session. The platform reported a 3.02% daily gain alongside a 23.82% advance over seven days, positioning Ethereum’s market capitalization near $283.06 billion.
CoinGlass tracked $5.07 billion in 24-hour spot volume, whereas futures turnover reached $74.22 billion over the identical timeframe. This wide gap highlights how derivatives traders heavily influenced short-term activity surrounding the recent price shift.
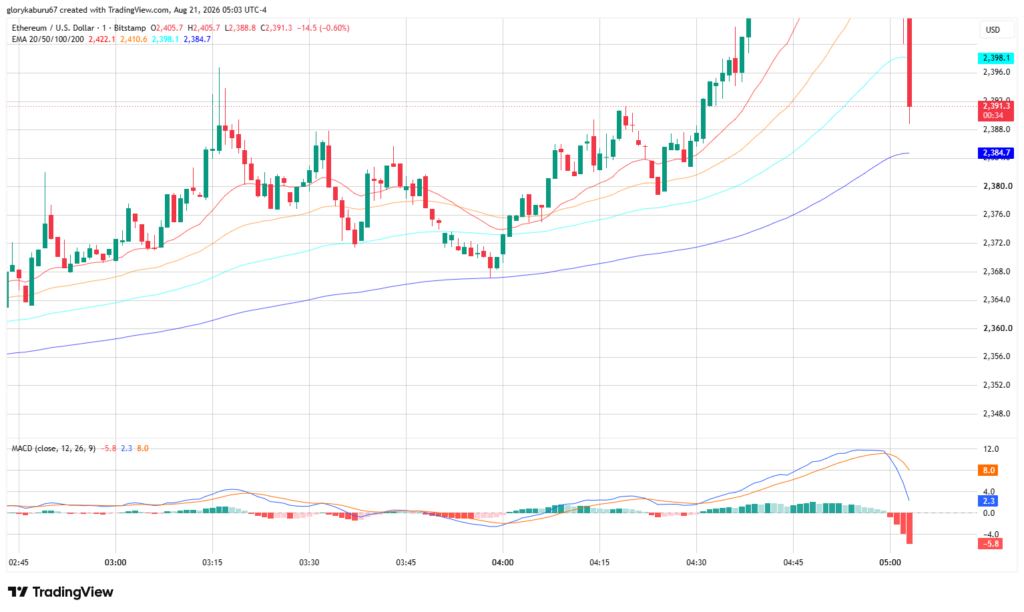
Historical figures from CoinGecko show ETH closed at $1,877.74 on Aug. 12, demonstrating that the subsequent push past $2,300 followed a swift repricing from mid-August lows. The TradingView ETH chart captured buyers temporarily driving the asset toward $2,396 before a market retracement occurred.
Records from the Ethereum Foundation confirmed that no new protocol upgrades went live during the Aug. 21 session. The official roadmap continues to slate the Glamsterdam upgrade for the second half of 2026, implying that immediate price action stemmed from market positioning instead of same-day network developments.
Ethereum Price Structure Keeps Bulls Above Key Averages
On the TradingView chart, ETH traded above all four tracked exponential moving averages. The 20-period average rested near $2,374.8, while the 50-period average hovered around $2,375.7. Furthermore, the 100-period and 200-period averages logged near $2,373.5 and $2,367.6, respectively.
Although this alignment maintained a constructive intraday structure, the moving averages remained tightly clustered together. Such compression narrows the margin between active support and failure thresholds, meaning a break beneath the cluster could rapidly undermine the recent recovery.
The Moving Average Convergence Divergence (MACD) showed slight improvement near the right edge of the chart. Its histogram shifted positive to 0.7 following several negative readings, though the MACD line stayed below zero, restricting clear momentum confirmation.
Ahead of the breakout, New York University’s Volatility Lab had already documented elevated volatility for Ethereum. Its model from Aug. 14 estimated one-month volatility at 48.27%, marking a 6.98% increase from prior observations.
This environment called for caution regarding short-term directional trades, as increased volatility can stretch intraday ranges without ensuring a lasting trend continuation. Consequently, the chart favored momentum over low-risk entries.
Ethereum Price Faces Leverage Risk After Short Liquidations
CoinGlass estimated Ethereum open interest at approximately $30.60 billion during the session alongside roughly $184.19 million in 24-hour ETH futures liquidations. These metrics underscore that leverage remained high in the wake of the rally.
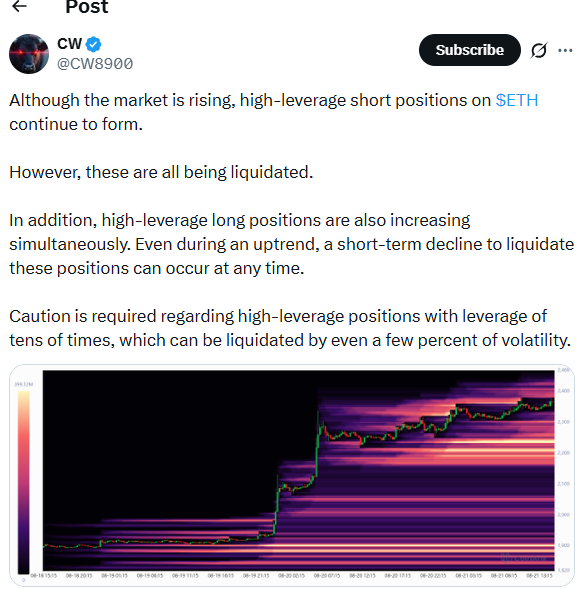
Crypto analyst CW noted on X that high-leverage short positions continued to accumulate during the advance, accompanied by an increase in leveraged long positions. This dynamic amplified risk on both ends of the spectrum should market volatility accelerate.
Another market analyst, Rain, pointed out that ETH successfully cleared the $1,980 to $2,000 resistance zone, designating $2,000 as the critical level requiring support verification. Because this zone sits well below current market prices, room remains for a deeper pullback.
Meanwhile, Crypto Tony highlighted the recent range high as the next upside target for testing. TradingView charts pegged immediate resistance between $2,388 and $2,396, indicating that a decisive breakout past this band would further reinforce the intraday recovery.
Ethereum Watches $2,367 Support and $2,396 Resistance
Immediate support rested near the 200-period exponential moving average at $2,367.6, with TradingView charts highlighting persistent trading activity between $2,374 and $2,376. Breaking below this cluster would leave the asset exposed to earlier intraday lows near $2,360.
On the upside, resistance clustered around the upper wick of the session near $2,396, with the broader $2,400 region serving as the next major test beyond that point. Market participants also had to contend with elevated derivatives exposure prior to any confirmed continuation.
Ethereum’s upcoming protocol milestone remains the Glamsterdam upgrade slated for the second half of 2026. Until then, the price of Ethereum relies heavily on liquidity conditions, leverage dynamics, and broader crypto fund flows, with immediate technical focus locked on the $2,367 support and $2,396 resistance levels.
Frequently Asked Questions
- What price level did Ethereum hold? Ethereum held above $2,370 during the August 21 session.
- What is the next major protocol upgrade for Ethereum? The Glamsterdam upgrade is scheduled for the second half of 2026.
- What are the key technical levels to watch? Key levels include immediate support near $2,367 and resistance around $2,396.
- Why is leverage a risk for Ethereum currently? Elevated futures open interest and high leverage create risks of sharper intraday swings and liquidations.