主要洞察:
- Ethereum price sustained its position above $2,370 as leveraged positioning expanded.
- ETH futures activity significantly outpaced spot trading volume.
- 2,396 美元附近的阻力位可能决定下一个短期方向走势。
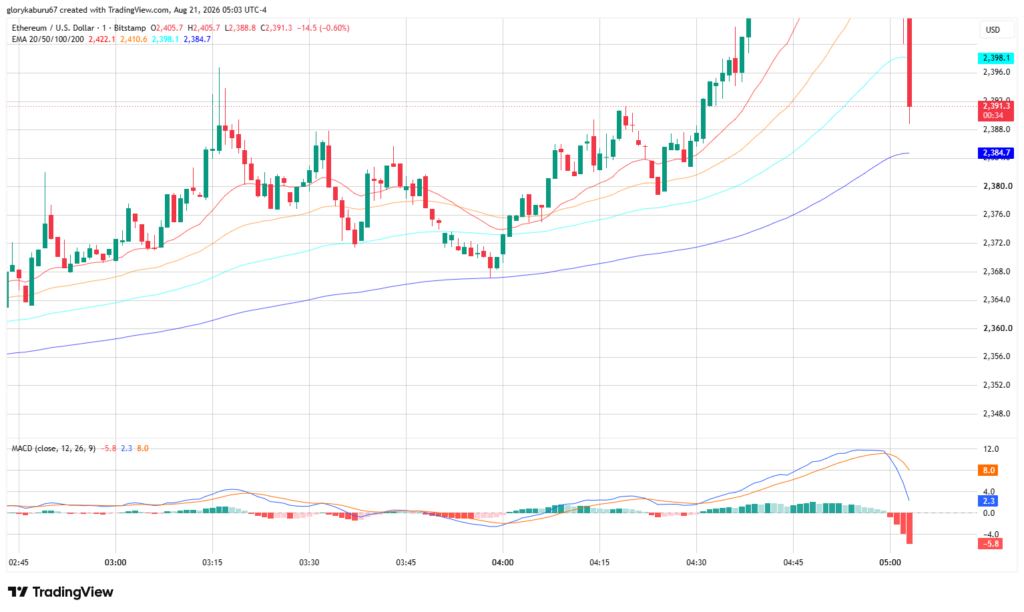
Ethereum’s price maintained levels above $2,370 on Aug. 21 following a robust rally that broke through prior resistance. TradingView’s one-minute ETH/USD chart registered $2,376.1 at 04:04 UTC-4, keeping momentum positive while leverage metrics signaled mounting liquidation risk.
This upward movement was notable because derivatives activity scaled much faster than spot market turnover. Such an imbalance leaves ETH vulnerable to sharp intraday fluctuations if leveraged traders unwind positions concurrently. Meanwhile, ETH as its native asset.">Ethereum’s broader development roadmap provided no immediate catalyst for the market during this session.
交易活动加速,以太坊价格保持涨幅
Data from CoinGlass indicated that ETH traded close to $2,334 during the Aug. 21, 2026, session. The platform reported a 3.02% daily gain alongside a 23.82% advance over seven days, positioning 以太坊’s market capitalization near $283.06 billion.
CoinGlass tracked $5.07 billion in 24-hour spot volume, whereas futures turnover reached $74.22 billion over the identical timeframe. This wide gap highlights how derivatives traders heavily influenced short-term activity surrounding the recent price shift.
CoinGecko 的历史数据显示,ETH 在 8 月 12 日收于 1,877.74 美元,这表明随后突破 2,300 美元的走势是在经历自 8 月中旬低点以来的迅速重新定价后发生的。TradingView 的 ETH 图表记录了买方在市场回调之前曾一度将该资产推向 2,396 美元。
Records from the 以太坊 Foundation confirmed that no new protocol upgrades went live during the Aug. 21 session. The official roadmap continues to slate the Glamsterdam upgrade for the second half of 2026, implying that immediate price action stemmed from market positioning instead of same-day network developments.
以太坊价格结构保持多头位于关键均线上方
在 TradingView 图表上,ETH 的交易价格高于所有四个被追踪的指数移动平均线。20 周期均线在 2,374.8 美元附近,50 周期均线徘徊在 2,375.7 美元左右。此外,100 周期和 200 周期均线分别录得 2,373.5 美元和 2,367.6 美元附近。
Although this alignment maintained a constructive intraday structure, the moving averages remained tightly clustered together. Such compression narrows the margin between active support and failure thresholds, meaning a break beneath the cluster could rapidly undermine the recent recovery.
移动平均线收敛发散指标(MACD)在图表右侧边缘显示出微弱改善。在经历多次负值读数后,其柱状图转为正值 0.7,不过 MACD 线仍低于零,限制了明确的动能确认。
Ahead of the breakout, New York University’s Volatility Lab had already documented elevated volatility for Ethereum. Its model from Aug. 14 estimated one-month volatility at 48.27%, marking a 6.98% increase from prior observations.
这种环境要求在短期方向交易中保持谨慎,因为不断加剧的波动性可能会扩大日内波动区间,但无法确保趋势的持续。因此,图表更倾向于动能交易,而非低风险入场。
经历空头爆仓后,以太坊价格面临杠杆风险
CoinGlass 估计,在交易时段以太坊未平仓合约约为 306 亿美元,同时 24 小时 ETH 期货爆仓金额约为 1.8419 亿美元。这些指标强调,在反弹之后杠杆率仍然很高。
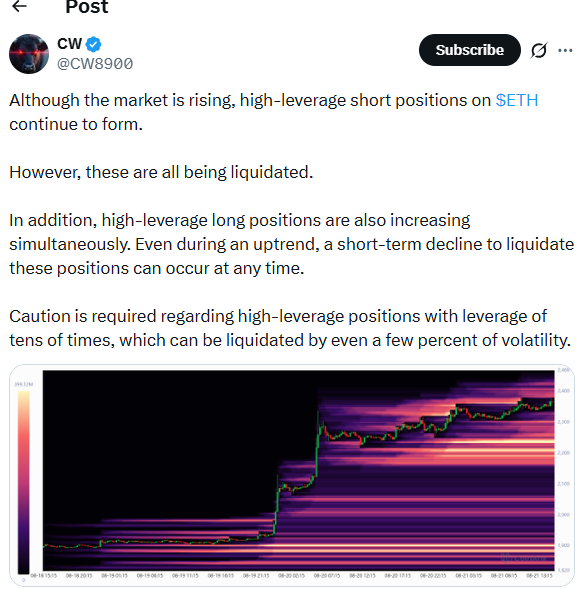
Crypto analyst CW noted on X that high-leverage short positions continued to accumulate during the advance, accompanied by an increase in leveraged long positions. This dynamic amplified risk on both ends of the spectrum should market volatility accelerate.
Another market analyst, Rain, pointed out that ETH successfully cleared the $1,980 to $2,000 resistance zone, designating $2,000 as the critical level requiring support verification. Because this zone sits well below current market prices, room remains for a deeper pullback.
Meanwhile, Crypto Tony highlighted the recent range high as the next upside target for testing. TradingView charts pegged immediate resistance between $2,388 and $2,396, indicating that a decisive breakout past this band would further reinforce the intraday recovery.
以太坊关注 2,367 美元支撑位和 2,396 美元阻力位
Immediate support rested near the 200-period exponential moving average at $2,367.6, with TradingView charts highlighting persistent trading activity between $2,374 and $2,376. Breaking below this cluster would leave the asset exposed to earlier intraday lows near $2,360.
On the upside, resistance clustered around the upper wick of the session near $2,396, with the broader $2,400 region serving as the next major test beyond that point. Market participants also had to contend with elevated derivatives exposure prior to any confirmed continuation.
以太坊接下来的协议里程碑是计划于 2026 年下半年进行的 Glamsterdam 升级。在此之前, 以太坊 的价格在很大程度上取决于流动性状况、杠杆动态以及更广泛的 加密货币 资金流向,目前的短期技术焦点锁定在 2,367 美元支撑位和 2,396 美元阻力位。
常见问题解答
- 以太坊守住了哪个价格水平? 在 8 月 21 日的交易时段中,以太坊坚守在 2,370 美元上方。
- 以太坊的下一个重大协议升级是什么? Glamsterdam 升级计划于 2026 年下半年进行。
- 有哪些需要关注的关键技术位? 关键价位包括近 2,367 美元的即时支撑位和 2,396 美元附近的阻力位。
- 为什么说杠杆目前是以太坊的一个风险? 高企的期货未平仓合约和高杠杆带来了更剧烈日内波动和强平的风险。